

The News You Need To Know | January 2019
In this Q4 recap: waves of volatility hit Wall Street, trade pacts and disputes make headlines, oil takes a plunge, and the economy continues to perform well.
THE QUARTER IN BRIEF
Wall Street saw many ups and downs in the last three months of 2018. The fourth quarter concluded with bulls and bears vying for control of the market and with the S&P 500 suffering a 13.97%, three-month loss. The Federal Reserve sent conflicting signals about its implementation of monetary policy normalization, to the frustration of investors. No real progress was made in resolving the U.S.-China trade war, and the Brexit appeared to reach a standstill. The price of oil dropped sharply. The housing market gained a bit of momentum as home prices and mortgage rates both declined. The quarter was quite newsworthy, but its major headlines raised some troubling questions about the direction of the markets.1
DOMESTIC ECONOMIC HEALTH
On the whole, the economy looked quite good in the fall. Consumer spending increased 0.8% for October and 0.4% for November, with retail sales up 1.1% in the tenth month of the year and 0.2% in the eleventh. Retailers benefited from a great holiday sales season: on an annualized basis, consumer purchases made between November 1 and December 24 were up 5.1% compared to the same period in 2017.2,3
How was the jobs picture? Nonfarm payrolls expanded with 237,000 net new jobs during October; the November gain was 155,000. During both months, average yearly wage growth was at 3.1%. The main jobless rate held at 3.7%; the underemployment (U-6) rate moved north from 7.4% to 7.6%.2,7
Inflation was advancing just 2.2% a year by November; the 12-month increase had approached 3% as recently as July. Falling fuel costs helped tame inflation pressure. In late December, the Bureau of Economic Analysis stated the economy had expanded 3.4% in the third quarter, revising its previous estimate of 3.5%. With growth like that, it is not surprising that the Federal Reserve made its fourth rate move of the year in December, taking the target range on the federal funds rate to 2.25-2.5%. Top Fed officials sounded alternately dovish and hawkish during the fourth quarter. In October, Fed chair Jerome Powell commented that interest rates were “a long way” from neutral, irritating Wall Street.
GLOBAL ECONOMIC HEALTH
Overseas, manufacturing economies seemed to be slowing somewhat. Consumer demand slowed in China, where US tariffs also impacted growth. The European Union (and the world) waited for the Brexit to proceed. U.K. leaders, however, spent the quarter debating if it should unfold according to the deal that Prime Minister Theresa May had presented to the European Union. By December, May’s deal faced almost certain rejection in Parliament. There were three other options: another national referendum on the Brexit, a no-deal Brexit that would leave big businesses with headaches, or a “managed,” no-deal Brexit with some bilateral trade arrangements put in place. The deadline for the Brexit was still set for March 29.
REAL ESTATE
While the real estate market cooled off in 2018, the pace of home buying began to improve in the fourth quarter. By the estimations of the National Association of Realtors, existing home sales rose 1.4% in October and 1.9% in November. Perhaps sellers were lowering prices to meet prospective buyers on their turf.
A dip in mortgage rates could also have been a factor. In the last Freddie Mac survey of 2018 (December 27), the average interest rate for a conventional home loan was 4.55% nationally; it had been 4.72% three months earlier. (Rates on 15-year, fixed loans and 5/1-year, adjustable loans were respectively at 4.01% and 4.00% in the December 27 survey, compared with 4.16% and 3.97% in late September.)19
LOOKING BACK, LOOKING FORWARD
The fourth quarter is often hot for stocks, but this past one was ice cold. Equity investors grew concerned about the Federal Reserve’s plans for 2019, the evident economic deceleration in China and Europe, and a narrowing spread between long-term and short-term Treasury bond yields (which some consider a danger sign for recession).
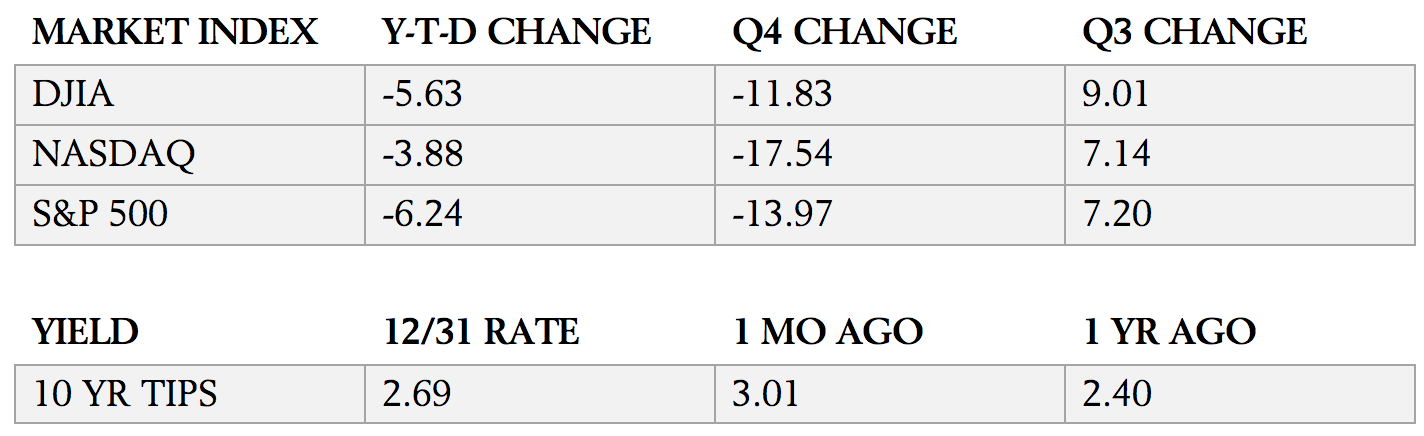
Sources: barchart.com, wsj.com, bigcharts.com, treasury.gov – 12/31/181,21,22
Indices are unmanaged, do not incur fees or expenses, and cannot be invested into directly. These returns do not include dividends. 10-year TIPS real yield = projected return at maturity given expected inflation.
The fourth quarter of 2018 was the poorest quarter on Wall Street in 11 years. Was the welcomed, large-cap rebound at the end of December a hint of better times ahead? Earnings season is about to start, and it might be just what the Street needs; before it begins, investors may tread cautiously. Wall Street cannot “resume normal programming” fast enough for some market participants, but the path toward stability may not be an easy one; the volatility seen in December may take weeks to moderate. In sum, 2019 presents investors with many more uncertainties than 2018 did, and patience will be required to contend with them. Patience, in fact, may be an investor’s greatest friend this quarter and year.23
This material was prepared by MarketingPro, Inc., and does not necessarily represent the views of the presenting party, nor their affiliates. The information herein has been derived from sources believed to be accurate. Please note – investing involves risk, and past performance is no guarantee of future results. Investments will fluctuate and when redeemed may be worth more or less than when originally invested. This information should not be construed as investment, tax or legal advice and may not be relied on for the purpose of avoiding any Federal tax penalty. This is neither a solicitation nor recommendation to purchase or sell any investment or insurance product or service, and should not be relied upon as such. All market indices discussed are unmanaged and are not illustrative of any particular investment. Indices do not incur management fees, costs, or expenses. Investors cannot invest directly in indices. All economic and performance data is historical and not indicative of future results. The Dow Jones Industrial Average is a price-weighted index of 30 actively traded blue-chip stocks. The NASDAQ Composite Index is a market-weighted index of all over-the-counter common stocks traded on the National Association of Securities Dealers Automated Quotation System. The Standard & Poor’s 500 (S&P 500) is a market-cap weighted index composed of the common stocks of 500 leading companies in leading industries of the U.S. economy. NYSE Group, Inc. (NYSE:NYX) operates two securities exchanges: the New York Stock Exchange (the “NYSE”) and NYSE Arca (formerly known as the Archipelago Exchange, or ArcaEx®, and the Pacific Exchange). NYSE Group is a leading provider of securities listing, trading and market data products and services. The New York Mercantile Exchange, Inc. (NYMEX) is the world’s largest physical commodity futures exchange and the preeminent trading forum for energy and precious metals, with trading conducted through two divisions – the NYMEX Division, home to the energy, platinum, and palladium markets, and the COMEX Division, on which all other metals trade. The CAC-40 Index is a narrow-based, modified capitalization-weighted index of 40 companies listed on the Paris Bourse. The DAX 30 is a Blue Chip stock market index consisting of the 30 major German companies trading on the Frankfurt Stock Exchange. The FTSE 100 Index is a share index of the 100 most highly capitalized companies listed on the London Stock Exchange. BSE Sensex or Bombay Stock Exchange Sensitivity Index is a value-weighted index composed of 30 stocks that started January 1, 1986. Nikkei 225 (Ticker: ^N225) is a stock market index for the Tokyo Stock Exchange (TSE). The Nikkei average is the most watched index of Asian stocks. The Hang Seng Index is a free float-adjusted market capitalization-weighted stock market index that is the main indicator of the overall market performance in Hong Kong. The All Ordinaries (XAO) is considered a total market barometer for the Australian stock market and contains the 500 largest ASX-listed companies by way of market capitalization. The SSE Composite Index is an index of all stocks (A shares and B shares) that are traded at the Shanghai Stock Exchange. The S&P/TSX Composite Index is an index of the stock (equity) prices of the largest companies on the Toronto Stock Exchange (TSX) as measured by market capitalization. The MSCI Emerging Markets Index is a float-adjusted market capitalization index consisting of indices in more than 25 emerging economies. The MSCI World Index is a free-float weighted equity index that includes developed world markets and does not include emerging markets. The CBOE Volatility Index® is a key measure of market expectations of near-term volatility conveyed by S&P 500 stock index option prices. The S&P SmallCap 600® measures the small-cap segment of the U.S. equity market. The Russell 2000 Index is a small-cap stock market index of the bottom 2,000 stocks in the Russell 3000 Index. Additional risks are associated with international investing, such as currency fluctuations, political and economic instability and differences in accounting standards. This material represents an assessment of the market environment at a specific point in time and is not intended to be a forecast of future events, or a guarantee of future results. MarketingPro, Inc. is not affiliated with any person or firm that may be providing this information to you. The publisher is not engaged in rendering legal, accounting or other professional services. If assistance is needed, the reader is advised to engage the services of a competent professional.
Citations.
1 – barchart.com/stocks/indices?viewName=performance [1/1/19]
2 – investing.com/economic-calendar/ [12/28/18]
3 – cbsnews.com/news/2018-holiday-sales-soar-to-6-year-high/ [12/20/18]
4 – investing.com/economic-calendar/cb-consumer-confidence-48 [12/27/18]
5 – tradingeconomics.com/united-states/consumer-confidence [12/27/18]
6 – instituteforsupplymanagement.org/ISMReport/NonMfgROB.cfm?SSO=1 [12/6/18]
7 – bloomberg.com/news/articles/2018-12-07/u-s-payrolls-rise-below-forecast-155-000-as-wage-gain-misses [12/7/18]
8 – marketwatch.com/story/cheaper-gas-tamps-down-consumer-inflation-in-november-cpi-shows-2018-12-12 [12/12/18]
9 – forbes.com/sites/jjkinahan/2018/12/19/hawkish-now-dovish-later-fed-hikes-but-lowers-projected-2019-rate-projections [12/19/18]
10 – scmp.com/news/china/diplomacy/article/2179505/us-china-trade-war-timeline-first-tariffs-90-day-truce [12/26/18]
11 – bloomberg.com/news/articles/2018-12-27/december-early-indicators-show-china-slowed-for-a-seventh-month [12/27/18]
12 – nasdaq.com/article/british-ministers-split-over-next-brexit-steps-if-pms-deal-fails-20181220-00145 [12/20/18]
13 – tinyurl.com/ycbvf56h [12/28/18]
14 – news.morningstar.com/index/indexReturn.html [12/31/18]
15 – msci.com/end-of-day-data-search [12/31/18]
16 – barchart.com/futures/performance-leaders?viewName=chart&timeFrame=3m [12/31/18]
17 – money.cnn.com/data/commodities/ [12/31/18]
18 – cleveland.com/business/2018/12/ohio-us-home-sales-down-in-november-from-last-years-levels.html [12/19/18]
19 – freddiemac.com/pmms/archive.html [1/1/19]
20 – money.cnn.com/data/markets/russell/?page=33 [1/1/19]
21 – quotes.wsj.com/index/SPX [9/28/18]
22 – treasury.gov/resource-center/data-chart-center/interest-rates/Pages/TextView.aspx?data=yieldAll [12/31/18]
23 – cnbc.com/2018/12/31/stock-market-wall-street-stocks-eye-us-china-trade-talks.html [12/31/18]