

The News You Need To Know | November 2018
In this month’s recap: another correction hits Wall Street, housing indicators raise questions, but consumer confidence, consumer spending, and GDP look healthy.
THE MONTH IN BRIEF
October certainly lived up to its reputation for volatility. The S&P 500 suffered its second correction of the year as investors wondered if they were seeing early signs of the peak of the current business cycle, absorbing news of moderating corporate earnings, while also considering the potential impact of higher interest rates and tariffs. Real estate indicators, for the most part, left much to be desired; labor, manufacturing, and consumer spending and confidence indicators were in better shape. Overseas, major and minor reductions in economic growth were forecast for various nations. In the commodities sector, oil and gasoline posted major losses.1
DOMESTIC ECONOMIC HEALTH
In a notable miss, the Department of Labor’s September employment report showed U.S. non-farm payrolls adding 134,000 net new hires. Economists surveyed by Bloomberg projected the gain at 185,000, and some wondered if Hurricane Florence might have affected the total. Headline unemployment fell 0.2%, however, to a remarkably low 3.7%. The jobless rate had not been that low since the end of the 1960s. The U-6 unemployment rate, which counts both the unemployed and underemployed, ticked south 0.1% to 7.4%. Another bright spot: the upward revision of the previous two months of hiring totals. The July jobs gain was boosted by 18,000 to 165,000; the August gain was upgraded from 201,000 to 270,000.3,4
The major reports in the following week covered retail sales and consumer prices, and they posed some question marks. Why had retail sales improved just 0.1% in August and September, in a presumably prospering economy? Turning to another closely watched indicator, the annualized rate of consumer inflation fell from 2.7% in August to 2.3% in September. (Core consumer inflation remained at a 2.2% yearly pace.) Seasonal fluctuations in fuel and energy costs may not be enough to explain the variance.
As the month stretched on, the federal government provided its initial estimate of third quarter economic expansion, and it was solid: 3.5%. That followed a 4.2% pace of growth in Q2. The six months ending in September represented the best back-to-back quarters for the economy since 2014.
Finally, wages improved 2.9% year-over-year through September, as the Department of Labor’s Employment Cost Index pointed out on Halloween. This was the largest annualized wage gain seen in a decade.6
GLOBAL ECONOMIC HEALTH
Last month, China’s National Bureau of Statistics reported Q3 economic expansion of 1.6%, leaving the nation’s projected 2018 GDP at 6.5%. The Chinese economy last grew that slowly in Q1 2009. China’s official growth target for the year is 6.5%, but its GDP was running at a 6.7% annual pace when the second quarter ended, prior to the direct impact of tariffs. The International Monetary Fund believes the U.S. tariffs on the P.R.C. will also affect the region’s other economies. Economic deceleration was also a rising concern in Europe. The European Central Bank projects 2018 eurozone growth of 2.0%, down from 2.5% in 2017.
WORLD MARKETS
Overseas stocks avoided month-long corrections, but still fell sharply like ours. MSCI’s World index stumbled 7.42% and its Emerging Markets index lost 8.78%. The most prominent European benchmarks all retreated 5% or more on the month.
COMMODITIES MARKETS
Light sweet crude and unleaded gasoline relinquished considerable ground in October. Oil ended the month at $65.02, falling 11.62%; gasoline shed 16.82%. October also saw natural gas add 9.00%, while heating oil lost 4.41%. In soft commodities, double-digit gains came for coffee (10.20%) and sugar (32.82%).
Gold posted an October gain of 2.38%, settling at $1,218.20 on the COMEX on Halloween. Silver lost 1.82% for the month, ending October at $14.28. Copper lost 4.56% for the month; platinum rose 2.91%. The greenback grew stronger in October: the U.S. Dollar Index advanced 2.08%.13,14
REAL ESTATE
Sometimes, the real estate sector transmits the first hint that a business cycle is weakening when home sales and groundbreaking begin to taper off. The jury is out on whether this is currently happening or whether the housing market is simply seeing a temporary slump. Admittedly, the latest indicators were not encouraging.15,16,17
The National Association of Realtors announced a 3.4% retreat for resales in September and projected a 1.6% decline in existing home sales for 2018. A Census Bureau report showed the rate of new home buying weakening 5.5% in the ninth month of the year. (At least NAR’s pending home sales index rose 0.5% in September, a nice change from its 1.9% August setback.) As for residential construction activity, further Census Bureau data had housing starts down 5.3% for September, building permits down 0.6%.4,15
Home loan interest rates climbed significantly between Freddie Mac’s September 27 and October 25 Primary Mortgage Market Surveys. The mean rate for the 30-year FRM rose from 4.72% to 4.86%. Similar moves occurred for the 5/1-year ARM (3.97% to 4.14%) and the refinancer’s favorite, the 15-year FRM (4.16% to 4.29%).
LOOKING BACK, LOOKING FORWARD
Small caps truly had a difficult October. The Russell 2000 corrected, losing 10.91% and wiping out its YTD gain. It ended the month at 1,541.11. Blue chips lost less than half that: the Dow Jones Industrial Average fell 5.07% to 25,115.76 across October. A 6.94% monthly loss left the S&P 500 at 2,711.74 on Halloween. The Nasdaq Composite stumbled 9.20%, ending October at 7,305.90.
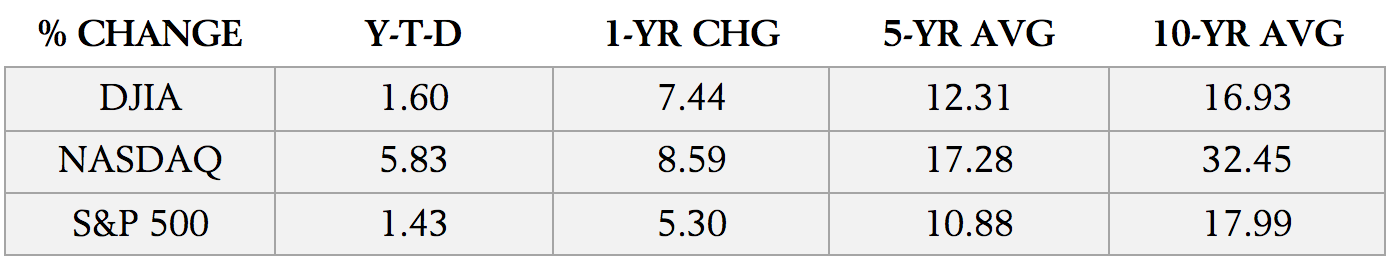
Sources: wsj.com, bigcharts.com, treasury.gov – 10/31/1819,20,21,22
Indices are unmanaged, do not incur fees or expenses, and cannot be invested into directly. These returns do not include dividends. 10-year TIPS real yield = projected return at maturity given expected inflation.
After the beating stocks took in October, will they recover to any great degree in November? A short-term bottom may not be immediate for either the Dow, S&P, or Nasdaq, as the concerns over central bank tightening, rising input costs, and reduced profits for businesses, tariffs, and reduced forecasts for growth in the European Union and Asia linger. It is a good bet that the market will see additional abrupt volatility. Wall Street ‹might manage a decent advance – as a Forbes article recently noted, the S&P 500 has gained an average of 7.1% during periods featuring a split Congress, regardless of which party occupies the Oval Office. That is history, not the future – but that is still somewhat encouraging. Investors could use some encouragement as they try to gauge the length of this presumably late phase of the bull market.23
This material was prepared by MarketingPro, Inc., and does not necessarily represent the views of the presenting party, nor their affiliates. The information herein has been derived from sources believed to be accurate. Please note – investing involves risk, and past performance is no guarantee of future results. Investments will fluctuate and when redeemed may be worth more or less than when originally invested. This information should not be construed as investment, tax or legal advice and may not be relied on for the purpose of avoiding any Federal tax penalty. This is neither a solicitation nor recommendation to purchase or sell any investment or insurance product or service, and should not be relied upon as such. All market indices discussed are unmanaged and are not illustrative of any particular investment. Indices do not incur management fees, costs and expenses, and cannot be invested into directly. All economic and performance data is historical and not indicative of future results. The Dow Jones Industrial Average is a price-weighted index of 30 actively traded blue-chip stocks. The NASDAQ Composite Index is a market-weighted index of all over-the-counter common stocks traded on the National Association of Securities Dealers Automated Quotation System. The Standard & Poor’s 500 (S&P 500) is a market-cap weighted index composed of the common stocks of 500 leading companies in leading industries of the U.S. economy. The Russell 2000 Index measures the performance of the small-cap segment of the U.S. equity universe. The CBOE Volatility Index® (VIX®) is a key measure of market expectations of near-term volatility conveyed by S&P 500 stock index option prices. NYSE Group, Inc. (NYSE:NYX) operates two securities exchanges: the New York Stock Exchange (the “NYSE”) and NYSE Arca (formerly known as the Archipelago Exchange, or ArcaEx®, and the Pacific Exchange). NYSE Group is a leading provider of securities listing, trading and market data products and services. The New York Mercantile Exchange, Inc. (NYMEX) is the world’s largest physical commodity futures exchange and the preeminent trading forum for energy and precious metals, with trading conducted through two divisions – the NYMEX Division, home to the energy, platinum, and palladium markets, and the COMEX Division, on which all other metals trade. The Bovespa Index is a gross total return index weighted by traded volume & is comprised of the most liquid stocks traded on the Sao Paulo Stock Exchange. The Mexican Stock Exchange, commonly known as Mexican Bolsa, Mexbol, or BMV, is the only stock exchange in Mexico. The MERVAL Index (MERcado de VALores, literally Stock Exchange) is the most important index of the Buenos Aires Stock Exchange. The Hang Seng Index is a free float-adjusted market capitalization-weighted stock market index that is the main indicator of the overall market performance in Hong Kong. Nikkei 225 (Ticker: ^N225) is a stock market index for the Tokyo Stock Exchange (TSE). The Nikkei average is the most watched index of Asian stocks. The Korea Composite Stock Price Index or KOSPI is the major stock market index of South Korea, representing all common stocks traded on the Korea Exchange. The FTSE TWSE Taiwan 50 Index consists of the largest 50 companies by full market value and is also the first narrow-based index published in Taiwan. The MSCI World Index is a free-float weighted equity index that includes developed world markets and does not include emerging markets. The MSCI Emerging Markets Index is a float-adjusted market capitalization index consisting of indices in more than 25 emerging economies. The IBEX 35 is the benchmark stock market index of the Bolsa de Madrid, Spain’s principal stock exchange. The CAC-40 Index is a narrow-based, modified capitalization-weighted index of 40 companies listed on the Paris Bourse. The DAX 30 is a Blue-Chip stock market index consisting of the 30 major German companies trading on the Frankfurt Stock Exchange. The FTSE 100 Index is a share index of the 100 companies listed on the London Stock Exchange with the highest market capitalization. The FTSEurofirst 300 Index comprises the 300 largest companies ranked by market capitalization in the FTSE Developed Europe Index. The MICEX 10 Index is an unweighted price index that tracks the ten most liquid Russian stocks listed on MICEX-RTS in Moscow. The SSE Composite Index is an index of all stocks (A shares and B shares) that are traded at the Shanghai Stock Exchange. The All Ordinaries (XAO) is considered a total market barometer for the Australian stock market and contains the 500 largest ASX-listed companies by way of market capitalization. The BSE SENSEX (Bombay Stock Exchange Sensitive Index), also-called the BSE 30 (BOMBAY STOCK EXCHANGE) or simply the SENSEX, is a free-float market capitalization-weighted stock market index of 30 well-established and financially sound companies listed on the Bombay Stock Exchange (BSE). The Nifty 50 (NTFE 50) is a well-diversified 50-stock index accounting for 13 sectors of the Indian economy. It is used for a variety of purposes such as benchmarking fund portfolios, index-based derivatives and index funds. The S&P/TSX Composite Index is an index of the stock (equity) prices of the largest companies on the Toronto Stock Exchange (TSX) as measured by market capitalization. The US Dollar Index measures the performance of the U.S. dollar against a basket of six currencies. Additional risks are associated with international investing, such as currency fluctuations, political and economic instability and differences in accounting standards. This material represents an assessment of the market environment at a specific point in time and is not intended to be a forecast of future events, or a guarantee of future results. MarketingPro, Inc. is not affiliated with any person or firm that may be providing this information to you. The publisher is not engaged in rendering legal, accounting or other professional services. If assistance is needed, the reader is advised to engage the services of a competent professional.
Citations.
1 – cnbc.com/2018/10/29/stock-market-dow-futures-seen-lower-amid-earnings-season-worries.html [10/29/18]
2 – instituteforsupplymanagement.org/ISMReport/NonMfgROB.cfm?SSO=1 [10/3/18] 3 – tinyurl.com/y8fcfr3b [10/5/18]
4 – investing.com/economic-calendar/ [10/31/18]
5 – marketwatch.com/story/third-quarter-gdp-cools-a-bit-to-a-still-solid-35-rate-2018-10-26 [10/26/18]
6 – philly.com/philly/business/u-s-workers-see-fastest-wage-increase-in-a-decade-20181031.html {10/31/18]
7 – cnbc.com/2018/10/19/china-q3-gdp-china-posts-economic-data-amid-trade-war-with-us.html [10/19/18]
8 – asia.nikkei.com/Economy/Trade-War/Reliance-on-China-risks-slowing-Southeast-Asia-economy [10/13/18]
9 – cnn.com/2018/10/25/economy/eurozone-growth-trade-war/index.html [10/25/18]
10 – theguardian.com/business/live/2018/oct/30/eurozone-gdp-french-italy-growth-economy-markets-business-live [10/30/18]
11 – markets.on.nytimes.com/research/markets/worldmarkets/worldmarkets.asp [10/31/18] 12 – msci.com/end-of-day-data-search [10/31/18]
13 – money.cnn.com/data/commodities [10/31/18]
14 – marketwatch.com/investing/index/dxy/historical [10/31/18]
15 – marketwatch.com/story/existing-home-sales-slump-to-a-near-3-year-low-as-buyers-back-out-2018-10-19 [10/19/18]
16 – freddiemac.com/pmms/archive.html [10/29/18]
17 – cnbc.com/2018/10/30/home-price-gains-fall-below-6percent-for-the-first-time-in-a-year-august-sp-case-shiller-indices.html [10/30/18]
18 – money.cnn.com/data/markets/russell/ [11/1/18]
19 – barchart.com/stocks/indices?viewName=performance [10/31/18]
20 – bigcharts.marketwatch.com/historical/default.asp?symb=DJIA&closeDate=10%2F31%2F17&x=0&y=0 [10/31/18]
20 – bigcharts.marketwatch.com/historical/default.asp?symb=COMP&closeDate=10%2F31%2F17&x=0&y=0 [10/31/18]
20 – bigcharts.marketwatch.com/historical/default.asp?symb=SPX&closeDate=10%2F31%2F17&x=0&y=0 [10/31/18]
20 – bigcharts.marketwatch.com/historical/default.asp?symb=DJIA&closeDate=10%2F31%2F13&x=0&y=0 [10/31/18]
20 – bigcharts.marketwatch.com/historical/default.asp?symb=COMP&closeDate=10%2F31%2F13&x=0&y=0 [10/31/18]
20 – bigcharts.marketwatch.com/historical/default.asp?symb=SPX&closeDate=10%2F31%2F13&x=0&y=0 [10/31/18]
20 – bigcharts.marketwatch.com/historical/default.asp?symb=DJIA&closeDate=10%2F31%2F08&x=0&y=0 [10/31/18] 20 – bigcharts.marketwatch.com/historical/default.asp?symb=COMP&closeDate=10%2F31%2F08&x=0&y=0 [10/31/18]
20 – bigcharts.marketwatch.com/historical/default.asp?symb=SPX&closeDate=10%2F31%2F08&x=0&y=0 [10/31/18]
21 – treasury.gov/resource-center/data-chart-center/interest-rates/Pages/TextView.aspx?data=realyield [11/1/18]
22 – treasury.gov/resource-center/data-chart-center/interest-rates/Pages/TextView.aspx?data=realyieldAll [10/31/18]
23 – forbes.com/sites/advisor/2018/10/29/midterm-elections-could-bode-well-for-u-s-stock-market-heres-why/ [10/29/18]