

Quarterly Economic Update
A review of 2Q 2016
The Quarter in Brief
As the first half of 2016 ended, the economy seemed to be repeating the pattern seen in 2014 and 2015 – a poor first quarter giving way to a better second quarter. Monthly indicators showed improvements in consumer spending, retail sales, and manufacturing. Consumer confidence also rose. The quarter did see a decline in the pace of hiring, and the red-hot housing sector cooled a bit. Oil prices rebounded, which really helped equities. For the first time in history, a country voted to leave the European Union. News of that vote stunned financial markets worldwide in June, to an even greater degree than the multiple terrorist attacks carried out by ISIS and its sympathizers. Bullish sentiment ultimately won out on Wall Street during a volatile quarter as the S&P 500 rose 1.90% in three months. The Federal Reserve left interest rates unchanged, which could be the case for some time.1
Domestic Economic Health
On May 27, Federal Reserve chair Janet Yellen reflected on the potential for an interest rate hike at Harvard University, commenting that “probably in the coming months such a move would be appropriate.” Other Fed officials were making hawkish statements of their own. At the end of the second quarter, a summer rate hike looked decidedly inappropriate – after the Brexit, traders lowered the possibility to 8% for the rest of 2016 and felt there would be a 20% chance the Fed would make a rate cut by early 2017.2,3
While Wall Street will likely not have to worry about an interest rate hike for the rest of the year, investors and economists alike may be a bit worried about the labor market. In May, the economy added just 38,000 jobs, and the government scaled down its estimate of hiring for March and April by a combined 59,000. Economists knew that monthly hiring would taper off from the 200,000 level at some point; in Q2, the labor market may have reached that point. In June, the unemployment rate was 4.7%, and the broader U-6 rate factoring in the underemployed was at 9.7%.4
The Institute for Supply Management’s manufacturing purchasing manager index (PMI) ended the quarter at a 16-month peak of 53.2, 5.0 points higher than it had been in January and 1.4 points higher than its March 2016 mark. ISM’s service sector PMI fell to 52.9 in May compared to a 55.7 April reading.5,6
Both major consumer confidence indexes posted quarterly advances. The University of Michigan’s index posted a final June mark of 93.5, up from its 91.0 final March reading; the Conference Board’s index ended the quarter at 98.0 compared to its (revised) March reading of 96.1.7,8
Consumer spending, the great engine of the U.S. economy, suddenly revved up during Q2. Flat in March, it jumped 1.1% in April and another 0.4% in May. Other Commerce Department data noted an acceleration in retail sales – that indicator improved 1.3% for April and 0.5% for May. While hard goods orders rose 3.3% for April, they lessened 2.2% in May.9,10
Core consumer prices rose 2.2% in the 12 months ending in May, and the federal government’s core Consumer Price Index advanced 0.2% in both April and May. The Producer Price Index rose 0.2% in April, then 0.4% in May; even after such gains, it was still down 0.1% year-over-year in May.10
Assessments of Q1 GDP improved over the quarter. The final estimate, according to the Bureau of Economic Analysis: a mere 1.1%. The first quarter did see a 2.0% rise in the Fed’s core PCE price index.10
Global Economic Health
Equities around the world had rallied immediately before the Brexit referendum in the United Kingdom, as polls indicated the “Remain” campaign might triumph over the “Leave” campaign. When the opposite occurred, global markets went haywire on June 24. On that day, Germany’s DAX lost 6.82%; Japan’s Nikkei 225, 7.92%; and France’s CAC-40, 8.04%. The pound hit a 31-year low versus the dollar, and both Standard & Poor’s and Fitch quickly downgraded their credit ratings for the U.K. to AA. Some journalists and economists see a severe recession hitting the U.K. once the actual Brexit occurs, measurably impacting the GDP of the E.U. and U.S. later in the decade.11,12
The E.U. now faces some unsettling questions. Will other nations now vote to leave it, following the U.K.’s example? Will the Brexit weaken the euro? Could it destroy the economic recovery evident in Europe? If central banks act to bolster the financial markets through stimulus, will their actions amount to anything more than an economic Band-Aid on a political problem? Bank of England governor Mark Carney spoke of a stimulus ahead for the U.K. economy, and other nations could respond in kind – but, in terms of interest rate cuts, some central banks would be veering toward negative rates. In the second quarter, Japan had its key interest rate at -0.1%, Sweden at -0.5%; benchmark interest rates in the U.S., U.K., and Canada all had target ranges topping out at 0.5%.13
Key Markit factory PMIs in Europe looked generally improved as the quarter ended; although, they seem poised to decline in coming quarters as the Brexit fallout impacts the eurozone. The PMI for the U.K. was at 52.1 in June and the eurozone PMI was at 52.8. Germany’s PMI hit a 28-month high of 54.5 and PMIs in Italy and Spain were, respectively, at 53.5 and 52.2. Contrast that with the Caixin (private sector) PMI for China, which hit a 4-month low of 48.6 in June; China’s official PMI was at 50.0. Japan’s Markit PMI was at 48.1 when the quarter ended; South Korea’s reached 50.5.14,15
World Markets
Even with the Brexit vote, some of the world’s notable stock indices ended the quarter in good YTD position. At the forefront was the Bovespa – Brazil’s benchmark was up 18.9% for the first six months of the year. Canada’s TSX Composite was ahead 8.1% YTD; Mexico’s IPC All-Share, 7.0%. The MSCI Emerging Markets index was up 5.0% for the year, and even the U.K.’s FTSE 100 had risen 4.2% YTD at the end of June. Taiwan’s TAIEX and India’s Sensex respectively ended the first half of 2016 3.9% and 3.4% better than they were at the end of 2015.16,17
Now to some of the “halftime losses.” The MSCI World Index ended June down 0.3% YTD; Australia’s ASX 200 was 1.2% lower for the year at the end of June. There were first-half losses of 5.1% for Hong Kong’s Hang Seng, 8.6% for France’s CAC-40, and 9.9% for Germany’s DAX. Four benchmarks had it much worse than that YTD as June concluded: Spain’s IBEX 35 was 14.5% lower; China’s Shanghai Composite, down 17.2%; Japan’s Nikkei 225, down 18.2%; and Italy’s FTSE MIB, 24.4% beneath its 2015 close.16,17
Commodities Markets
The Thomson Reuters/CoreCommodity CRB index rose 12.9% in the second quarter. This tremendous benchmark gain hints at what a spectacular quarter it was for select energy and ag futures.18
When June wrapped up, seven commodity futures were up 30% or more YTD: lean hogs at 39.3%; silver and heating oil at 34.9%; sugar at 34.2%; soybeans at 33.4%; diesel at 32.5%; and crude oil at 30.5%. Crude closed the quarter at $48.33 on the NYMEX; it rose 26.1% in Q2, having its best quarter in seven years. Natural gas futures rose to 49.0% in Q2, the greatest quarter for that commodity since 2005; that surge left 25.1% higher for the year as June concluded. Gasoline finished the first six months 18.1% higher than at the end of last year; coffee, 17.8%. Yes, a few commodities were down YTD at the close on June 30: wheat had lost 5.2%; cocoa, 8.2%; rough rice, 10.1%; and live cattle, 16.1%.16,19
Precious metals also had a fine quarter. Gold futures rose 6.9% to a settlement of $1,320.60 on the COMEX when Q2 ended. That put gold up 24.6% YTD. Silver finished Q2 at $18.62, its highest close since September 2014; it rose 20.4% for the quarter on the way to its amazing first-half gain. Palladium was up 6.3% YTD thanks to a 5.9% Q2 gain; platinum rose 4.8% in Q2 for a YTD advance of 14.7%. The U.S. Dollar Index added on 1.4% for Q2.20,21
Real Estate
Existing home sales improved by 1.3% in April and another 1.8% in May, according to the National Association of Realtors. The quarter saw a wild swing in new home buying – the Census Bureau said sales were up 12.3% in April and down 6.0% in May.10
Housing starts and building permits both rose 4.9% in April, but both Census Bureau indicators cooled in May – permits were up 0.7%, while groundbreaking declined 0.3%. Looking at the monthly 20-city Case-Shiller home price index, we see a 1.0% gain for April and a 1.1% gain for May; the annualized advances were 5.5% for April, 5.4% for May. Housing contract activity, as chronicled by NAR’s pending home sales index, rose 3.9% in April, then fell 3.7% a month later. By May, the pending sales index was actually down 0.2% year-over-year.10
Mortgage rates really fell in Q2, one factor that helped home sales even as inventory was tight. In the March 31 Freddie Mac Primary Mortgage Market Survey, the average interest rate on a 30-year fixed-rate loan was 3.71%, while interest rates on the 15-year FRM and 5/1-year ARM, respectively, averaged 2.98% and 2.90%. In the June 30 PMMS, mean interest rates on these mortgages were as follows: 30-year fixed, 3.48%; 15-year fixed, 2.78%; 5/1-year adjustable, 2.70%.22
Looking Back…Looking Forward
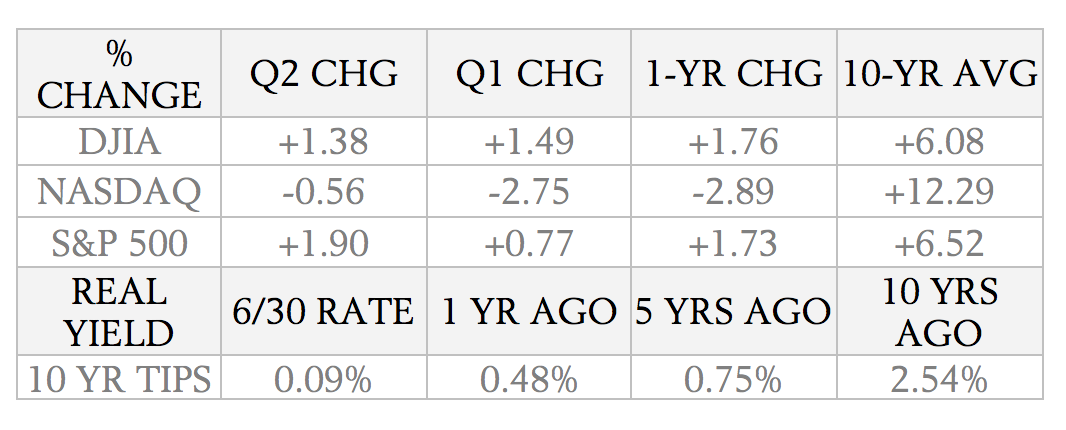
Here was where the key U.S. indices ended the second quarter: Dow, 17,929.99; Nasdaq, 4,842.67; S&P 500, 2,098.86; Russell 2000, 1,152.43; CBOE VIX, 15.63. The Russell rose 1.59% in the quarter; the VIX, 14.91%.23,24
The VIX was not the quarter’s top-performing index. The Dow Jones Utility Average was the most prominent index that outgained it, jumping 24.0%. The telecom services and energy sectors of the S&P, respectively, advanced 21.8% and 14.3% in Q2.16,23,24
Sources: spindices.com, finance.google.com, bigcharts.com, treasury.gov – 6/30/161,25,26,27,28
Indices are unmanaged, do not incur fees or expenses, and cannot be invested into directly.
These returns do not include dividends.
After the Brexit news, is Wall Street managing to regain its footing here in the third quarter? You could argue that Q3 could be less volatile than some analysts expect. The Brexit leaves some huge question marks for investors about the U.K. economy, the E.U. economy, and the global economy, but the answers may take years to emerge. In the near term, what seems almost certain is that the Federal Reserve will avoid raising interest rates. That alone may breed a little bullishness and lead investors to refocus on corporate profits and earnings guidance. Will the next earnings season be slightly better than expected? Will we see some earnings growth again in the third quarter? No, the U.S. economy cannot divorce itself from the effects of the Brexit – but U.S. investors expect to see the federal funds rate near its historic low for some time, meaning one potentially significant headwind against stocks may have eased for 2016.
This material was prepared by MarketingPro, Inc., and does not necessarily represent the views of the presenting party, nor their affiliates. This information has been derived from sources believed to be accurate. MarketingPro, Inc. is not affiliated with any broker or brokerage firm that may be providing this information to you. This information should not be construed as investment, tax or legal advice and may not be relied on for the purpose of avoiding any Federal tax penalty. This is not a solicitation or recommendation to purchase or sell any investment or insurance product or service, and should not be relied upon as such. The Dow Jones Industrial Average is a price-weighted index of 30 actively traded blue-chip stocks. The NASDAQ Composite Index is an unmanaged, market-weighted index of all over-the-counter common stocks traded on the National Association of Securities Dealers Automated Quotation System. The Standard & Poor’s 500 (S&P 500) is an unmanaged group of securities considered to be representative of the stock market in general. It is not possible to invest directly in an index. NYSE Group, Inc. (NYSE:NYX) operates two securities exchanges: the New York Stock Exchange (the “NYSE”) and NYSE Arca (formerly known as the Archipelago Exchange, or ArcaEx®, and the Pacific Exchange). NYSE Group is a leading provider of securities listing, trading and market data products and services. The New York Mercantile Exchange, Inc. (NYMEX) is the world’s largest physical commodity futures exchange and the preeminent trading forum for energy and precious metals, with trading conducted through two divisions – the NYMEX Division, home to the energy, platinum, and palladium markets, and the COMEX Division, on which all other metals trade. The Bovespa Index is a gross total return index weighted by traded volume & is comprised of the most liquid stocks traded on the Sao Paulo Stock Exchange. The S&P/TSX Composite Index is an index of the stock (equity) prices of the largest companies on the Toronto Stock Exchange (TSX) as measured by market capitalization. The Mexican IPC index (Indice de Precios y Cotizaciones) is a major stock market index which tracks the performance of leading companies listed on the Mexican Stock Exchange. The MSCI Emerging Markets Index is a float-adjusted market capitalization index consisting of indices in more than 25 emerging economies. The FTSE 100 Index is a share index of the 100 most highly capitalized companies listed on the London Stock Exchange. Taiwan Capitalization Weighted Stock Index (abbr. TAIEX) is a stock market index for companies traded on the Taiwan Stock Exchange (TWSE). TAIEX covers all of the listed stocks excluding preferred stocks, full-delivery stocks and newly listed stocks, which are listed for less than one calendar month. BSE Sensex or Bombay Stock Exchange Sensitivity Index is a value-weighted index composed of 30 stocks that started January 1, 1986. The MSCI World Index is a free-float weighted equity index that includes developed world markets, and does not include emerging markets. The S&P/ASX 200 index is a market-capitalization weighted and float-adjusted stock market index of Australian stocks listed on the Australian Securities Exchange from Standard & Poor’s. The Hang Seng Index is a freefloat-adjusted market capitalization-weighted stock market index that is the main indicator of the overall market performance in Hong Kong. The CAC-40 Index is a narrow-based, modified capitalization-weighted index of 40 companies listed on the Paris Bourse. The DAX 30 is a Blue Chip stock market index consisting of the 30 major German companies trading on the Frankfurt Stock Exchange. The IBEX 35 is the benchmark stock market index of the Bolsa de Madrid, Spain’s principal stock exchange. The SSE Composite Index is an index of all stocks (A and B shares) that are traded at the Shanghai Stock Exchange. Nikkei 225 (Ticker: ^N225) is a stock market index for the Tokyo Stock Exchange (TSE). The Nikkei average is the most watched index of Asian stocks. The FTSE MIB (Milano Italia Borsa) is the benchmark stock market index for the Borsa Italiana, the Italian national stock exchange. The US Dollar Index measures the performance of the U.S. dollar against a basket of six currencies. Additional risks are associated with international investing, such as currency fluctuations, political and economic instability and differences in accounting standards. This material represents an assessment of the market environment at a specific point in time and is not intended to be a forecast of future events, or a guarantee of future results. Past performance is no guarantee of future results. Investments will fluctuate and when redeemed may be worth more or less than when originally invested. All information is believed to be from reliable sources; however we make no representation as to its completeness or accuracy. All economic and performance data is historical and not indicative of future results. Market indices discussed are unmanaged. Investors cannot invest in unmanaged indices. The publisher is not engaged in rendering legal, accounting or other professional services. If assistance is needed, the reader is advised to engage the services of a competent professional.
Citations.
1 – us.spindices.com/indices/equity/sp-500 [6/30/16]
2 – bloomberg.com/news/articles/2016-05-27/yellen-leans-toward-near-term-rate-rise-without-detailing-timing [5/27/16]
3 – fortune.com/2016/06/27/fed-interest-rate-brexit/ [6/27/16]
4 – thestreet.com/story/13595435/1/weird-jobs-report-transforms-the-landscape-for-fed-s-rate-decision.html [6/3/16]
5 – instituteforsupplymanagement.org/ismreport/mfgrob.cfm [7/1/16]
6 – tradingeconomics.com/united-states/non-manufacturing-pmi [7/3/16]
7 – investing.com/economic-calendar/cb-consumer-confidence-48 [7/3/16]
8 – tradingeconomics.com/united-states/consumer-confidence [7/3/16]
9 – tradingeconomics.com/united-states/personal-spending [7/3/16]
10 – tradingeconomics.com/united-states/calendar [7/3/16]
11 – markets.on.nytimes.com/research/markets/worldmarkets/worldmarkets.asp [6/24/16]
12 – theguardian.com/business/live/2016/jun/27/pound-shares-markets-brexit-crisis-osborne-lew-business-live [6/27/16]
13 – tinyurl.com/hr2t7v2 [7/1/16]
14 – reuters.com/article/us-global-economy-idUSKCN0ZH3P7 [7/1/16]
15 – ft.com/fastft/2016/07/01/manufacturing-pmis-germany-jumps-france-flops/ [7/1/16]
16 – tinyurl.com/zxrn4kn [7/1/16]
17 – msci.com/end-of-day-data-search [6/30/16]
18 – investing.com/indices/thomson-reuters—jefferies-crb-historical-data [7/3/16]
19 – marketwatch.com/story/oil-prices-ease-after-biggest-gain-in-2-months-2016-06-30 [6/30/16]
20 – marketwatch.com/investing/index/dxy/historical [7/3/16]
21 – coinnews.net/2016/06/30/gold-silver-soar-in-first-half-of-2016-us-coin-sales-slow-in-june/ [6/30/16]
22 – freddiemac.com/pmms/archive.html?year=2016 [7/3/16]
23 – investing.com/indices/major-indices [6/30/16]
24 – google.com/finance?ei=lQp6V9GXJ8KGjAKegoXwCA&q=RUT [7/3/16]
25 – google.com/finance?q=INDEXNASDAQ:.IXIC&ei=kap5V5mbHqP9iQLlm5iQDw [7/3/16]
26 – google.com/finance?q=INDEXDJX%3A.DJI&ei=GA16V5jXCsKGjAKegoXwCA [7/1/16]
27 – bigcharts.marketwatch.com/historical/default.asp?symb=DJIA&closeDate=6%2F30%2F15&x=0&y=0 [6/30/16]
27 – bigcharts.marketwatch.com/historical/default.asp?symb=COMP&closeDate=6%2F30%2F15&x=0&y=0 [6/30/16]
27 – bigcharts.marketwatch.com/historical/default.asp?symb=SPX&closeDate=6%2F30%2F15&x=0&y=0 [6/30/16]
27 – bigcharts.marketwatch.com/historical/default.asp?symb=DJIA&closeDate=6%2F30%2F06&x=0&y=0 [6/30/16]
27 – bigcharts.marketwatch.com/historical/default.asp?symb=COMP&closeDate=6%2F30%2F06&x=0&y=0 [6/30/16]
27 – bigcharts.marketwatch.com/historical/default.asp?symb=SPX&closeDate=6%2F30%2F06&x=0&y=0 [6/30/16]
28 – treasury.gov/resource-center/data-chart-center/interest-rates/Pages/TextView.aspx?data=realyieldAll [7/3/16]