

Quarterly Economic Update
A review of 1Q 2016
The broad market closed out the first quarter of 2016 slightly higher than when it started the year, but along the way, many investors experienced a fairly wild ride.
Early in January, U.S. stock markets nosedived, with the S&P 500 index falling about -10.3%. This decline technically qualified as a Market Correction (a decline of 10% or more, peak-to-trough). The most prominent factors behind this decline included:
- A sharp drop in the global price of oil
- Continued economic slowdowns in Emerging Markets, especially China
- Uncertainty around the next Fed rate hike — when, how much, how would it be justified
- Global Central Bank policy divergence — U.S. Fed tightening while Japanese and many European Central Banks continued their massive easing
- Extraordinary political polarization and anxiety over the U.S. Presidential Elections
- Few of these factors are systemic or even particularly long term, but together they made many investors cautious, even nervous…at least for a few weeks.
Adding to the pain and anxiety of this market correction, we were also caught up in what is called a Volatility Cluster, making the correction feel much worse than it actually was.
The Nature of Volatility Clusters
Analysts have different ways to measure and track stock market volatility. One of the most useful and widely available is the VIX Index, which measures the market’s thinking on volatility, i.e. its current expectation for future price swings. The graph below shows the behavior of the VIX Index over the last eight months:
Volatility S&P 500 (VIX)
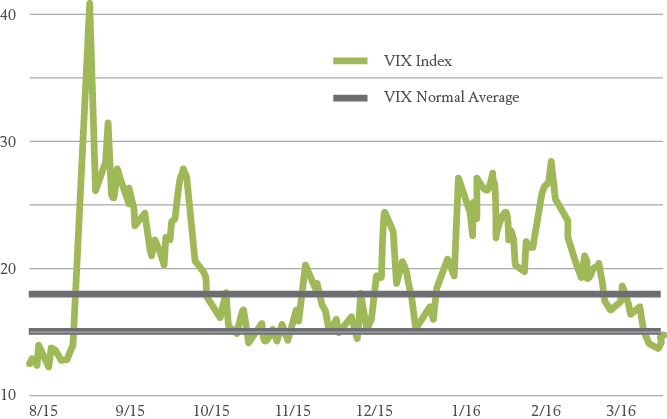
Source: VIX Index data is from Yahoo Finance. Aug 1,2015 to Mar 31, 2016. VIX range of 15%-18% highlighted. Indexes are unmanaged baskets of securities that are not available for direct investment by investors. Index performance does not reflect the expenses associated with the management of an actual portfolio.
As far back as the 1960s, researchers noticed that daily occurrences of large stock market swings tended to cluster together.1 A highly-volatile day was more likely to lead to another volatile day than a calm day, and vice versa.
Later, researchers discovered that these clusters of volatile days tended to be associated with periods of sustained market decline. Likewise, periods of low volatility tend to be associated with a rising stock market.2 Volatility Clusters are typically triggered by external events, such as the sharp drop in oil prices, overnight sell-offs in foreign markets and negative geopolitical events that we experienced over the last eight months.
Why is this Important?
The combination of a Volatility Cluster with sharp declines in the market can fuel kneejerk selling from worried investors, which can trigger the market to go down further and lead to hysterical headlines such as: “Worst Start to Year Ever”; “Crash to Destroy Capitalism”; or “Wave of Selling” (all actual headlines from 2016).
Unfortunately, too many investors took these headlines seriously and sold — potentially turning temporary declines into permanent losses.
Has the Current Cluster Subsided?
The current Volatility Cluster began in late summer of 2015, when the VIX jumped from a very quiet reading of 12% during early August to a peak of nearly 41% during subsequent weeks. Over the same period, the S&P 500 experienced a maximum peakto-trough decline of 10.3%. The Dow also experienced ten 300+ point daily tumbles.
As the chart below indicates, this five to six month Volatility Cluster appears to have run its course by the end of February 2016.
Volatility S&P 500 (VIX)
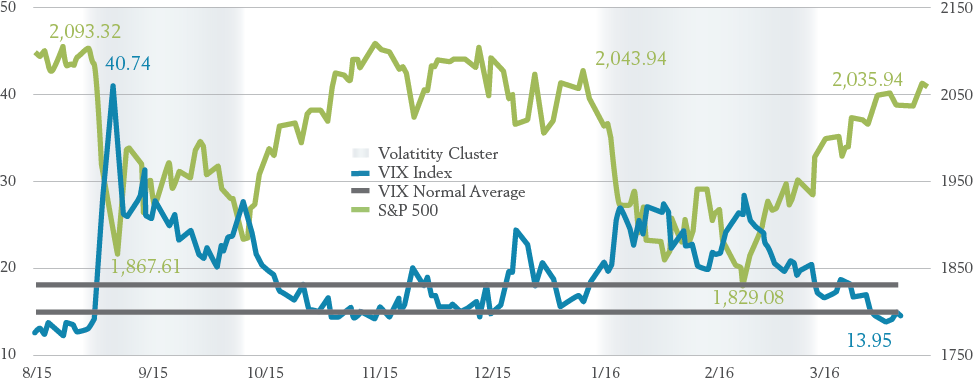
Source: VIX Index data and S&P 500 Index data are from Yahoo Finance. Aug 1, 2015 to Mar 31, 2016. VIX range of 15%-18% highlighted. Volatility Cluster defined as Aug 21, 2015 to Oct 2, 2015 and Jan 8, 2016 to Mar 4, 2016. Indexes are unmanaged baskets of securities that are not available for direct investment by investors. Index performance does not reflect the expenses associated with the management of an actual portfolio. Past performance is not a guarantee of future results. All investments involve risk, including loss of principal. The CBOE Volatility Index® (VIX®) is a key measure of market expectations of near-term volatility conveyed by S&P 500 stock index option prices. It represents one measure of the market’s expectation of stock market volatility over the next 30-day period.
The VIX ended the first quarter of the year well below the 15% level that is considered to indicate calmer markets.
During the same time, we see that the Correction reversed course as well. By the end of March, the S&P 500 had recovered, and the market was in positive territory for the year. The above chart also shows how closely the level of the stock market matched the upsurge and eventual collapse of the most recent Volatility Cluster.
How Should We View Volatility Clusters?
It is tempting to think that Volatility Clusters might predict market direction. This is not necessarily the case and cannot be relied upon from an investment perspective.
Short-term market movements are driven by both fundamental and speculative factors, such as the sharp and unexpected volatility in global oil prices this quarter.
Such short-term drivers are inherently unpredictable.
Options pricing show that right after the first spike in volatility, option prices shoot up and the opportunity to profitably exploit a Volatility Cluster in the short run quickly vanishes.
Volatility Clustering is informative, but it is priced into the market — it cannot predict all the short-term factors that can arise suddenly to change market direction. Volatility Clusters are merely reactive. Therefore, we believe that just like returns, volatility should not be timed or chased.
History has shown that once a Cluster settles down — which tends to happen anywhere from four to six weeks to six months on average, the stock market is more likely being pushed higher by longer-term factors such as economic growth.
Does Volatility Cluster at the Portfolio level?
Volatility Clustering has been observed in almost all traded markets, from stocks to bonds and currencies.
At the portfolio level, efficient markets — along with the healthy benefits of well-diversified portfolios — tend to quell the clustering by design. And this is yet another reason why we strongly believe in vast global diversification across asset classes, companies, countries, currencies, etc.
Diversification neither assures a profit nor guarantees against loss in a declining market.
Here’s the bottom line:
Worries that substantial market declines would trigger a global recession are usually not borne out by data or evidence.
- In Q1, most global markets experienced market corrections, with maximum declines of 10% or more
- However, U.S. bond markets ended up relatively flat, while global bonds matched the broad U.S. Equity market for the quarter
- REITs, Emerging Markets, and U.S. Value showed positive returns, while U.S. Small and International Large Value ended down for the quarter
- The market fundamentals remain strong
- Our economy is only partially linked to the economic prospects of China
- Regardless of whether oil is cheap oil or expensive, what remains more important to markets is stability of oil prices
So, the next time you suspect that markets are in the middle of a Volatility Cluster, don’t panic. Try not to draw conclusions or believe the headlines that we are in the midst of another great depression, or that portfolio optimization no longer works, or that premiums have ceased to exist, etc. There is no way to avoid or to benefit from a Volatility Cluster.
The portfolio models Loring Ward provides are built and managed with the goal of optimizing the long-term growth potential of markets around the world and to help investors to get where they want to go.
We had a few bumpy weeks earlier this year, but we experienced nothing in the first quarter that we believe suggested or necessitated any changes to our portfolio models.
Investment advisory services provided by LWI Financial Inc. (“Loring Ward”). Securities transactions offered through its affiliate, Loring Ward Securities Inc., member FINRA/SIPC. R 16-077 (4/18)
Treasury notes are guaranteed as to repayment of principal and interest by the U.S. government. All investments involve risk, including loss of principal. Foreign securities involve additional risks, including foreign currency changes, political risks, foreign taxes, and different methods of accounting and financial reporting. Fixed income investments are subject to interest rate and credit risk. Emerging markets involve additional risks, including, but not limited to, currency fluctuation, political instability, foreign taxes, and different methods of accounting and financial reporting. Real estate securities funds are subject to changes in economic conditions, credit risk and interest rate fluctuations. All investments involve risk, including the loss of principal and cannot be guaranteed against loss by a bank, custodian, or any other financial institution. The risks associated with investing in stocks and overweighting small company and value stocks potentially include increased volatility (up and down movement in the value of your assets) and loss of principal.
Citations.
1 Mandelbrot, B. B. (1963). “The Variation of Certain Speculative Prices.” The Journal of Business, 36, 394-419
2 Rama Cont (2005). Volatility Clustering in Financial Markets: Empirical Facts and Agent-Based Models. Long memory in economics.
It is tempting to think that Volatility Clusters might predict market direction. This is not necessarily the case and cannot be relied upon from an investment perspective.
Such short-term drivers are inherently unpredictable.
Volatility Clustering has been observed in almost all traded markets, from stocks to bonds and currencies.
Worries that substantial market declines would trigger a global recession are usually not borne out by data or evidence.